


Do collectivistic values lead to happiness?
A multimodal analysis group research project


Authors: Jacob Zhang, Guanhong Liu, Xuewei Li, Dan Gilles and Mark Valadez
University of Chicago, MCSS 37000 (Deep Learning), Spring 2024
Introduction: Collectivism and Happiness
Imagine you just received a job offer from two different companies. At the first company, employees place great emphasis on self-interest and strive for personal achievement. At the second one, employees like to cooperate and contribute to the company’s collective goals. Which company would you prefer to work for?

In psychology, we refer to the culture of the first company as ‘individualistic’, opposite to the ‘collectivistic’ culture of the second company. On the whole, most people seem to prefer collectivist workplaces. A study of 161 employees from 109 organizations in Portugal asked these employees to both report their personal individualism-collectivism orientations and rate how cooperative their organizations are. Employees were on average happier in more cooperative organization environments, and employees who rated high on collectivism were consistently happier than their individualistic peers (Rego & Cunha 2009). Consistent findings are obtained in other studies that investigate micro-communities, such as workspaces and universities (Ogihara and Uchida, 2014).
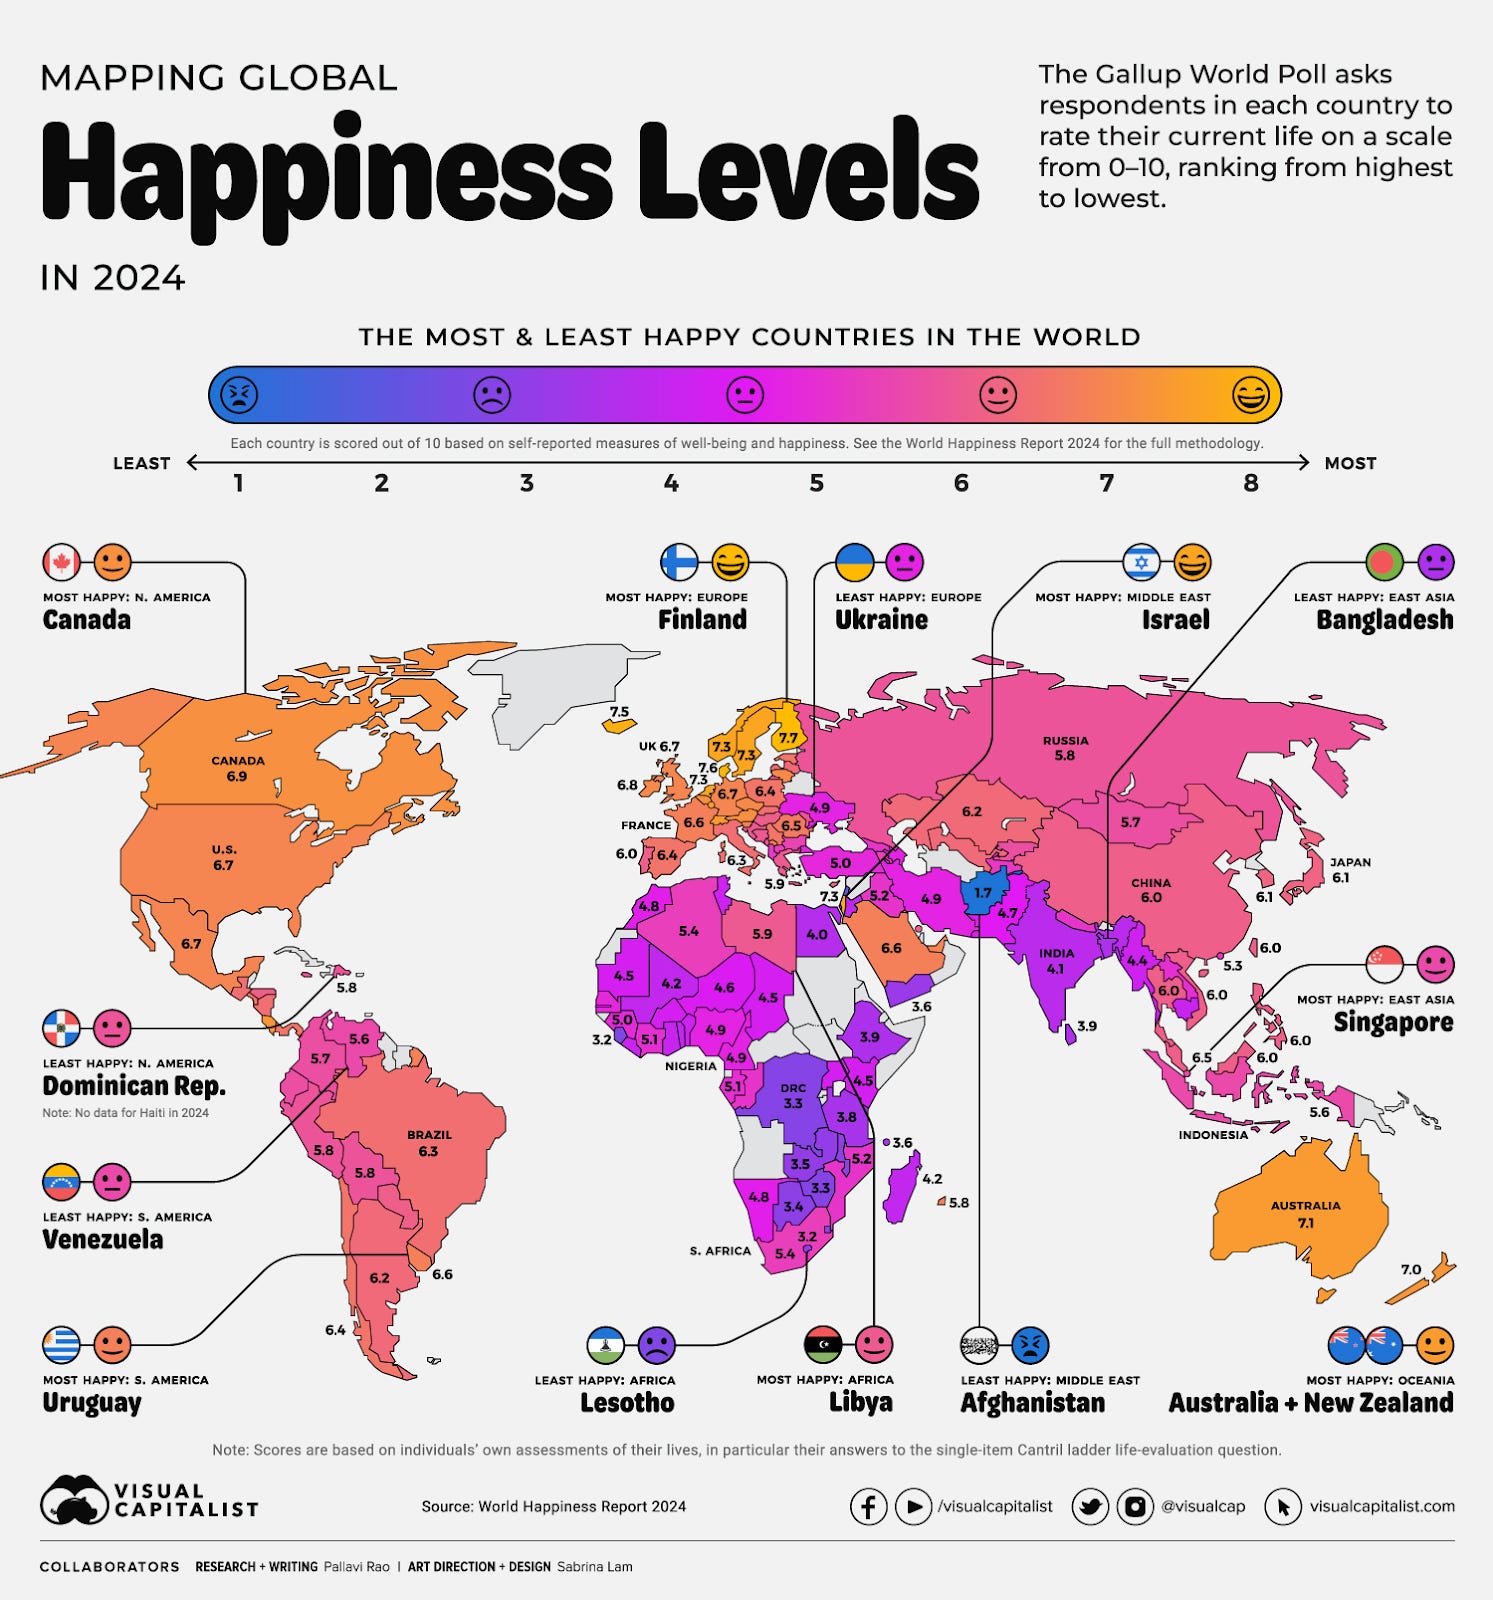
On a macro level, however, the story is different. Driven by the ‘invisible hand’ of self-interest and the desire for freedom, individualistic societies tend to outperform collectivistic societies in economics and fare better on social issues, such as discrimination and individual rights. Therefore, people living in countries that score high on individualism (such as Denmark, Australia, the UK) also self-report higher levels of happiness:
With this context, our group is interested in whether given the same macro culture of individualism in the US, people who score high on collectivism or are a part of collectivistic communities are also happier. This leads to our hypothesis:
Within the US, having more collectivistic values is associated with higher happiness.
We decided to investigate this hypothesis multimodally, i.e. with more than one form of data. Multimodal analysis can increase robustness by investigating whether the same effect is present in multiple sources, such as text, images, videos, surveys, and geographic data. This approach allows researchers to triangulate findings, mitigate potential biases associated with individual modalities, and gain a more comprehensive understanding of the phenomenon under study.
In our case, we chose three sources of media to investigate our hypothesis with: images, text, and survey data. We built one deep learning model for each data source. In the case of images and text, we conducted sentiment analysis, the identification of affect and emotion in data (and something which machine learning models are traditionally quite good at). With surveys, we took a more innovative approach, representing survey results as embeddings and using an autoencoder to encode and reconstruct the original embeddings (Hinton & Salakhutdinov 2006). This way we can build our own notion of collectivism and individualism separate of survey indices at national and state levels, which are less granular if we want to say anything about any given individual’s happiness.
For images, we operationalized individualism-collectivism based on the seminal study by Coon and Kemmelmeier 2001 which ranked the following four ethnicities in America in ascending order of collectivism: African American, White American, Latin American, Asian American. Accordingly, we use race as an (admittedly imperfect) proxy for collectivism for our image data.
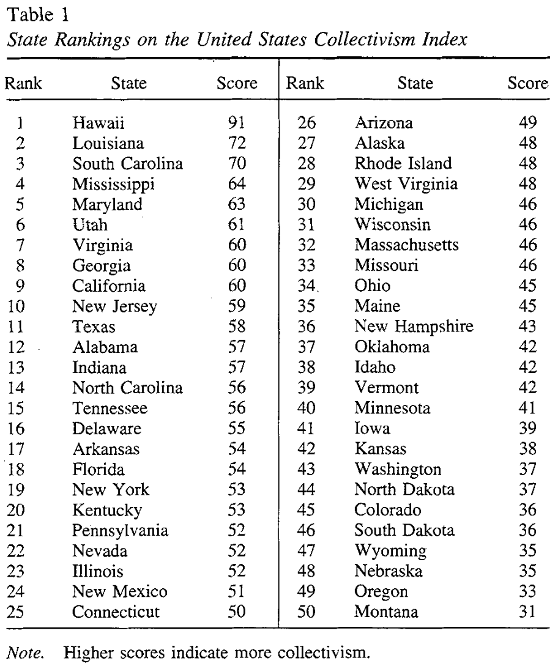
For text, we downloaded a subreddit for each US state. We operationalized individualism-collectivism based on a widely-used index compiled by Vandello & Cohen 1999, which ranked each US state by how collectivistic they are according to eight indicators (right). As shown below (left), Hawaii was ranked as the most collectivistic state in the US, whereas Montana was the most individualistic state.
For our survey model, we switched approaches to tailor it to the form of data. Since the World Values Survey provides the most granular level of description for the collectivism-individualism spectrum, but it only has one question on happiness, we took an embedding approach through a Table Auto Encoder to redefine what Collectivism and Individualism means for our survey respondents.
Methods/Findings
Images
Dataset
For our image survey, we are using an existing dataset from “FairFace: Face Attribute Dataset for Balanced Race, Gender, and Age” (Kärkkäinen and Joo, 2019). FairFace is a novel dataset aimed at addressing racial bias in existing public face image research datasets, which are predominantly composed of Caucasian (white) faces. As Merler et al. 2019 find, more than 80 percent of faces stored in popular research databases are white. Thus, non-white faces are significantly underrepresented. Here is an example of a popular public research database for facial recognition, almost all white:

Biased data will produce biased models and biased analysis. Hence, FairFace introduces a more balanced dataset of 108,501 facial images, sourced mainly from the YFCC-100M Flickr dataset, with additional images from Twitter and online newspapers. It includes balanced representations of seven race groups: White, Black, Indian, East Asian, Southeast Asian, Middle Eastern, and Latino. Each image is labeled for race, gender, and age, and all of the samples are US citizens.


In our views, this dataset has two major merits. First, it has a balanced composition across all racial groups, which can ensure consistent classification accuracy across different racial groups, enhancing the fairness and generalization of face analytic models. Second, the faces here are mostly from ordinary people, who can represent social trends better than celebrities, avoiding the elite bias of many image datasets.
Model
Now let’s talk about the model. We are using an open-sourced model for reproducibility. Specifically, we emply a model called the Residual Masking Network (RMN), introduced in the paper “Facial Expression Recognition using Residual Masking Network”:
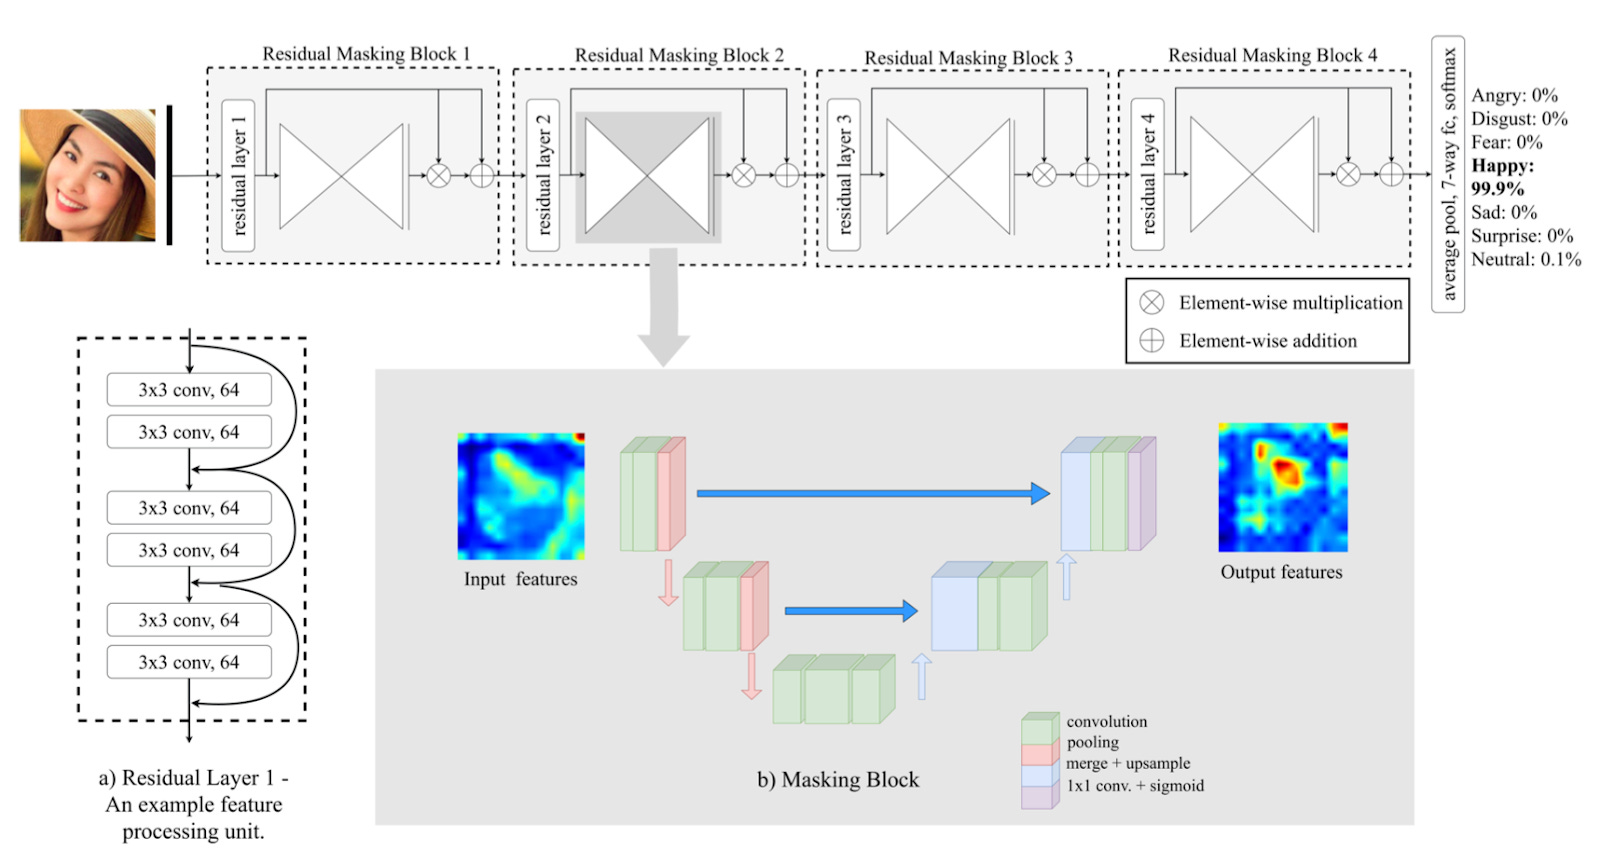
The RNN uses 50 layers, specifically leveraging residual connections to improve the flow of gradients and prevent vanishing gradient problems. This model consists of four main Residual Masking Blocks, each containing a Residual Layer and a Masking Block. Also, the model architecture integrates a Deep Residual Network with a U-net-like design, focusing on refining feature maps to enhance relevant facial features. The model is trained on several large-scale facial expression datasets, including FER2013, VEMO and RAF-DB, which are commonly used for facial expression recognition tasks.
Why is the RMN a good model for us? We think this model is effective for several reasons. First, it incorporates a novel masking idea that uses U-net-like structures to focus on crucial facial regions, enhancing the network's ability to detect subtle facial expressions. Meanwhile, the use of residual layers helps in mitigating the vanishing gradient problem, allowing the network to learn deeper representations without degradation. The model combines Deep Residual Networks with U-net-like blocks to leverage the strengths of both architectures, leading to better feature extraction and localization.

Additionally, by refining feature maps and scoring their importance, the model ensures that the most relevant features (such as eyes, nose, and mouth) are emphasized, improving the accuracy of expression recognition. The model achieves state-of-the-art accuracy on the FER2013 dataset (74.14% without ensemble, 76.82% with ensemble), demonstrating its superior performance compared to other well-known networks. The RMN also performs well on other datasets, including private ones like VEMO, indicating its robustness and ability to generalize across different datasets and conditions. These features collectively make the RMN a powerful and reliable model for automatic facial expression recognition.
Now, the fun part: Let’s see what will happen when we apply the RMN model to the FairFace dataset. As always, the first step is to pre-process the data so that it can best serve our purpose. When doing a preliminary check of the dataset, we found some strange values for the variable age. For example, instead of being an age range like “10-19” or “20-29”, there were a number of specific dates like “9Mar” or “19Sep”. These values are confusing and not helpful in answering our question, so we removed images with such questionable date values.
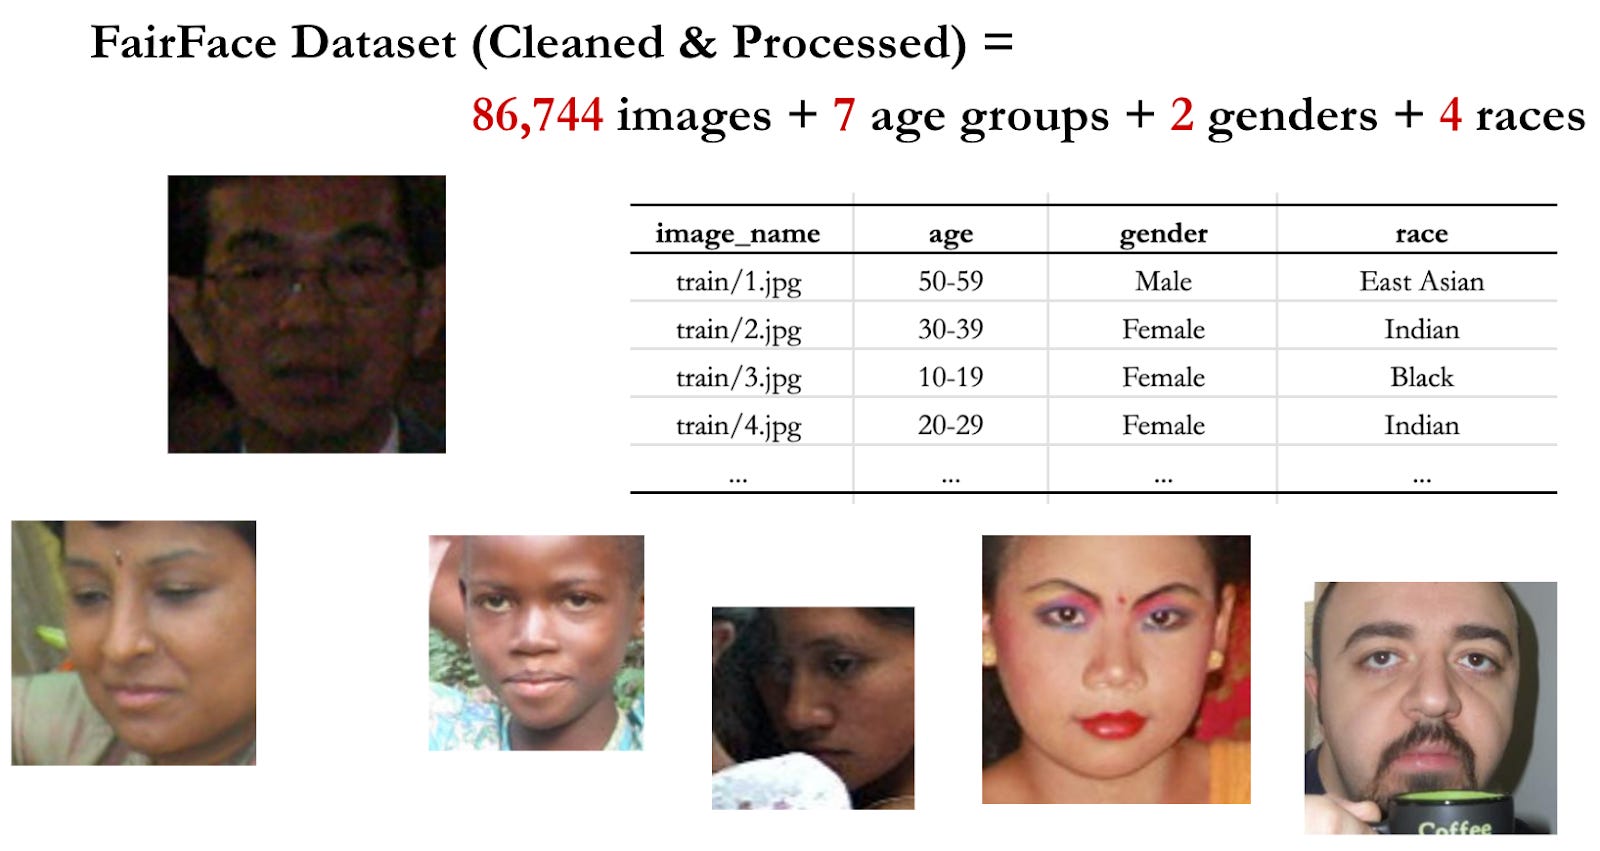
After removing these images, the dataset is clean enough to proceed to the next step. Above is an overview of the cleaned Fairface dataset. In total, it contains 86,744 images, divided into seven age groups, two gender groups and four race groups. As mentioned above, the original FairFace dataset has seven race groups. We recoded these into four groups, for reasons which we will explain below.
The next step is to apply the model to the cleaned dataset. One good thing about using a pre-trained model is that you could have the arguably best results writing down only one line of code. And the whole process is free! In our case, the magic spell is:
m.detect_emotion_for_single_frame()
For each given image, the model will return two values that are crucial for subsequent analysis. The two values are showcased above. The first is emo_label, which represents the emotion that the model thinks is most accurate based on the facial expression in the given image. The variable has seven values: happy, angry, sad, neutral, surprise, fear, and disgust. The second is emo_proba, representing the probability of the assigned emotion label to be accurate. The model actually returns seven probability values corresponding to each emotion. But for the sake of simplicity, we only take the highest probability and its corresponding emotion label.
The downside of the model is that it can only process one image at a time. Given the large number of images in our dataset, no one would feel happy waiting for the model to process them one by one. We therefore split the images into 18 batches and regularly saved results when one batch was done. By doing so, we also improved our code efficiency, and prevented ourselves from crushing our own computer when the Colab Notebook crashed 98 times for absolutely no reason when it was so close to finishing.
After obtaining the most likely emotion label for each image, we created a new variable called race_regroup to recode the seven race groups into four: Asian American, White American, Latin American, and African American. We used the new race variable as a proxy for individualism. According to the study introduced in the Introduction, the level of individualistic values decreased in the following order: African American > White American > Latin American > Asian American. Accordingly, we assigned values to the variable individualism_index from 4 to 1. Below is the final dataset we used for subsequent descriptive and inferential analysis.

We performed descriptive analysis before moving onto any inferential analysis. Figure 1 shows the distribution of the seven emotion labels in the dataset:

“Happy” is the dominant emotion in our dataset (over 35%), which guarantees enough images to address our question. In contrast, we have very few images predicted as “disgust”. Besides, “neutral”, “surprise”, and “fear” are also among the less frequent emotions. Images labeled as “angry” and “sad” are the second and third most frequent emotion, taking up approximately 14% of the dataset respectively.
In Figure 2, each bar is further broken down by race. We cannot tell any clear pattern from the graph, but we are glad to see that across the seven emotions, the proportion of each race group remains relatively constant. Asian American contribute to almost half of the images, White American nearly 25%, and Latin as well as African American around 12.5% or less. The balance among race groups helps us generate solid inferential analysis.

We run two multinomial logistic regressions to test our hypothesis. We hypothesize that people from individualistic cultures are less happy than those from collectivist cultures. The dependent variable is emo_label, representing the emotion label of a given image. The variable of interest is individualism_index, representing the level of individualism of the culture of a given race. We include age and gender as control variables. We set “happy” as the reference category in both multinomial logistic regression models.
Figure 3 shows the relevant model output for a regression model where we include all images and calculate the effect of individualism on being assigned to a category other than happy:

Results in Figure 3 lend support to our hypothesis. All coefficients are positive, meaning that higher individualism scores are consistently linked to lower chances of being happy compared to any negative (sadness, anger, fear, disgust) or neutral (surprise, neutrality) emotion. The biggest coefficients are 0.18 (disgust) and 0.14 (neutral), indicating that people coming from more individualistic cultures are more likely to feel disgusted or show neutral feelings rather than feeling happy. All results except for “angry” are statistically significant.
Figure 4 shows the output for the second regression model where we only include images with emo_probability over 0.5, meaning the model is at least 50% confident that the predicted emotion label is accurate for a given image:

The second model serves as a robustness check for our analysis. We believe that it is necessary to be cautious when the predictions made by the RNM model have an accuracy rate that is less than 80%. (If a surgery has more than a 20% chance to fail, any patient would think twice before going into the surgery room.)
The robustness check further consolidates our findings, if not providing a stronger proof. Again, all coefficients are positive, and the coefficients for “disgust” and “neutral” remain among the highest. The highest coefficient in this model, however, turns out to be “sad” (0.15), suggesting that for people coming from more individualistic cultures, they are statistically more likely to be sad rather than happy.
Overall, the first multimodal model shows that people from more individualistic cultures are less likely to feel happy, and more likely to feel sadness and disgust rather than happiness. Together, the two multinomial regression models lend support to our hypothesis. Yeah!
Text
Dataset
To investigate whether collectivism was associated with happiness in text, we worked with the widely used Pushshift.io Reddit dataset (Baumgartner et al. 2020). We want to study levels of collectivism and happiness across America, so we decided to use the aforementioned state collectivism index from Vandello & Cohen 1999 as our dependent variable:
individualism_dic = { 'hawaii': 91, 'louisiana': 72, 'south carolina': 70, 'mississippi': 64, 'maryland': 63, 'utah': 61, 'virginia': 60, 'georgia': 60, 'california': 60, 'new jersey': 59, 'texas': 58, 'alabama': 57, 'indiana': 57, 'north carolina': 56, 'tennessee': 56, 'delaware': 55, 'arkansas': 54, 'florida': 54, 'new york': 53, 'kentucky': 53, 'pennsylvania': 52, 'nevada': 52, 'illinois': 52, 'new mexico': 51, 'connecticut': 50, 'arizona': 49, 'alaska': 48, 'rhode island': 48, 'west virginia': 48, 'michigan': 46, 'wisconsin': 46, 'massachusetts': 46, 'missouri': 46, 'ohio': 45, 'maine': 45, 'new hampshire': 43, 'oklahoma': 42, 'idaho': 42, 'vermont': 42, 'minnesota': 41, 'iowa': 39, 'kansas': 38, 'washington': 37, 'north dakota': 37, 'colorado': 36, 'south dakota': 36, 'wyoming': 35, 'nebraska': 35, 'oregon': 33, 'montana': 31 }Next, we need to collect posts from users in different states. Reddit is a semi-anonymous forum so it is not possible to identify users’ location information directly. However, Reddit has subreddits for every state in the US. For instance, here is “r/illinois”:
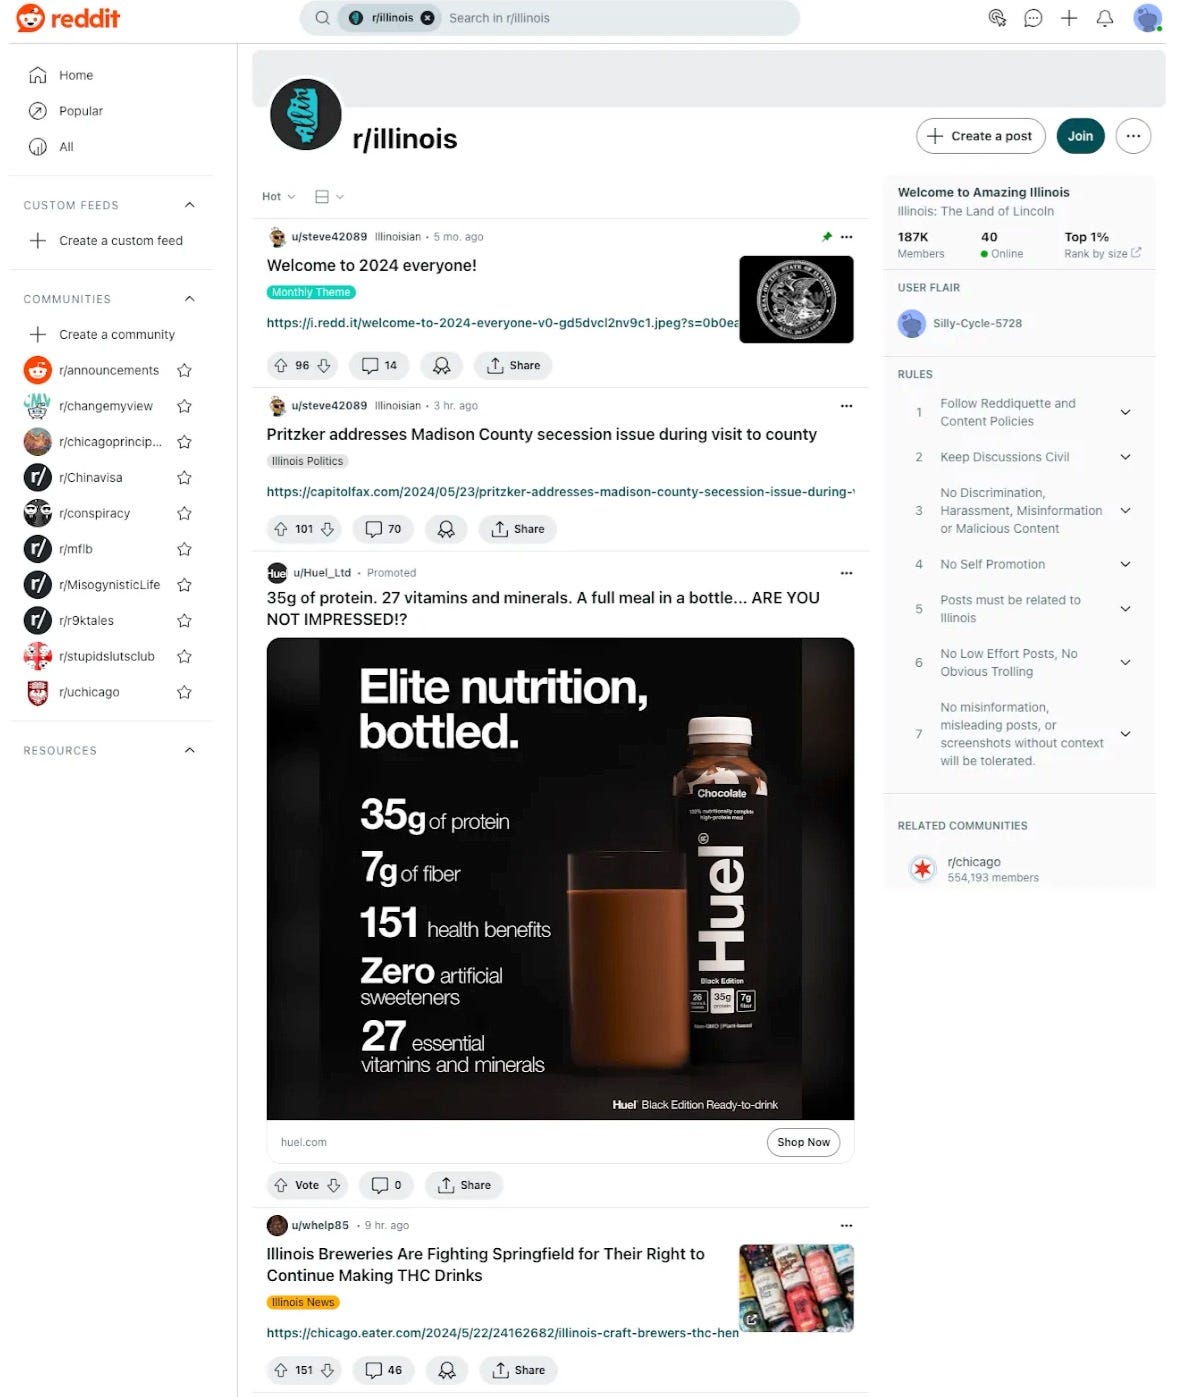
Due to the local nature of topics, we think that most posters on “r/illinois” will be people living in Illinois. Accordingly, we operationalize participation in state-specific subreddits as a proxy for geographic location within the US, and collect data from the subreddits of 46 states. This is an imperfect technique which likely has some amount of sampling bias introduced, as not all (or even most) residents of a state are likely to post on the subreddit. However, this is the best proxy we came up with for location; in future work we hope to investigate alternative options.
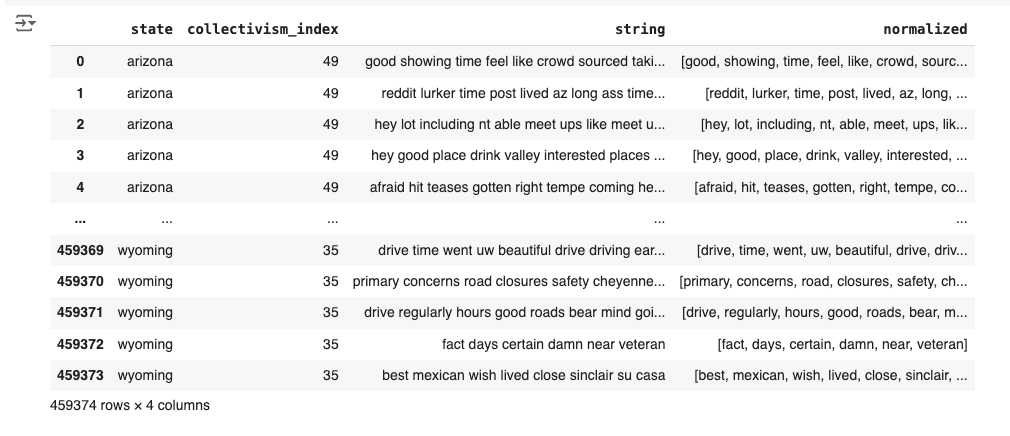
To obtain the Reddit posts, we used the ConvoKit package from Cornell NLP, which provides access to the Pushift.io archive. After downloading each state’s corpus, we restrict our sample to the first 10,000 posts per state, and combine these with the state collectivism indices to produce a database of posts by state and by collectivism index:
Clustering and dimensionality reduction
We use two algorithms from sklearn to help visualize these texts with machine learning. First, after removing stop-words and normalizing, we use tf-idf to vectorize the posts based on their feature words. In essence, each post is transformed into a mathematized representation of itself (a vector) based on the most unusual words that occur within it.
We then use sklearn’s k-means clustering algorithm to search for latent clusters within the data. The algorithm attempts to sort the vectorized posts in a way that will minimize the differences within each group (homogeneity) while also not separating similar posts into different groups (completeness).
We experimented with k-values from 3 to 50. These charts show the visualization of the clusters arrived at by the algorithm, together with a PCA overlay of the top feature words from the tf-idf vectorization in the same space:


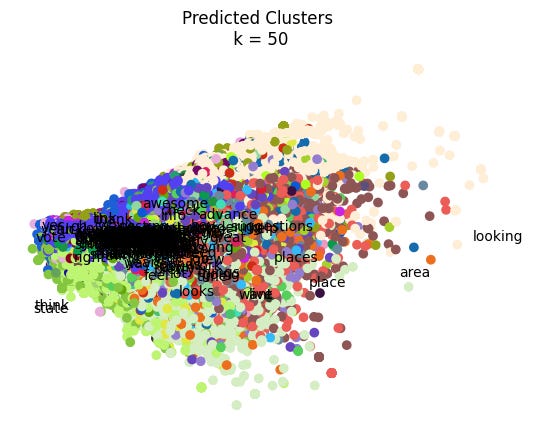
Although the clusterings look fascinating, no significant patterns appear regarding collectivism. Homogeneity and completeness metrics are <0.1 (bad) in all cases.
Word embeddings
We then use the gensim package to train two separate word embeddings models on our data. We train a word2vec model (vector_size=100, window=8, min_count=5) on the complete corpus for each state, and a doc2vec model (vector_size=64, window=2, min_count=1, workers=8, epochs = 40) for each post individually.
To examine the doc2vec vectors, we sort the posts into six buckets of roughly equal size based on collectivism index. Each post now has a doc2vec vector and a collectivism bucket associated with it We then plot these vectors on their first three dimensions, with the collectivism bucket as hue:

Results remain difficult to interpret, and even after using UMAP to reduce the dimensionality of the embeddings, we are unable to identify any patterns for the document embeddings.

It may be that independently training doc2vec models does not work. Regardless, we proceeded to examine individual word embeddings.
Geometry of happiness
Following Kozlowski, Taddy and Evans (2019), we construct an axis in the embedding space of each of our 46 word2vec models to represent the overall concept of happiness. This is done by identifying antonym pairs related to happiness and unhappiness. We used five pairs, ‘happy — unhappy’, ‘happiness — unhappiness’, ‘enjoy — suffer’, ‘fun — bored’, and ‘enjoyed — depressed’. The axis is then constructed by representing each antonym pair as an individual vector, and then averaging the vectors. This diagram from Kozlowski et al. illustrates this process, with an overall ‘affluence’ vector being constructed from the average of ‘poor — rich’, ‘poorer — richer’, ‘poverty — affluence’, ‘inexpensive — expensive’, and ‘impoverished — wealthy’:

Once we have identified this happiness vector, we project words that we identified as collectivistic versus individualistic onto it. As reviewed at the start of this article, the collectivistic words were family, group and community oriented, such as ‘community’, ‘children’ and ‘grandparents’, whereas individualistic words were more self-focused, such as ‘individual’ and ‘lone’.
pos_lst = ['happy', 'happiness', 'enjoy', 'fun', 'enjoyed'] neg_lst = ['unhappy', 'sad', 'suffer', 'bored', 'depressed']

collec_words = ['group', 'groups', 'meetups', 'family', 'community', 'meetup', 'daughter', 'daughters', 'son', 'child', 'children', 'parent', 'parents', 'grandparent', 'grandparents', 'sister', 'brother', 'sisters', 'brothers', 'friend', 'friends', 'siblings']
indiv_words = ['individual', 'solitary', 'individuals', 'single', 'solely', 'lone', 'lonely']

total_words = collec_words + indiv_words
Using the word2vec models that we trained for each US state, we project every collectivism-individualism word onto its corresponding happiness vector, thus obtaining a cosine-similarity value for each word. For each word, we then aggregate the projection values for all states, plotting a regression graph like the one below:

Here, the x-axis represents how collectivistic the state is, and the y-axis represents how semantically close the given word (‘lonely’ in this case) and the concept of happiness are. With a p value of 0.0312, this graph shows that redditors that are active in collectivistic r/states associate loneliness significantly less with happiness.
The table below shows our full results:

Collectivistic states are significantly more likely to associate ‘grandparent’, ‘siblings’ with happiness, whereas ‘lone’ and ‘lonely’ with unhappiness. However, it comes as a surprise that, with marginal significance, collectivistic states also associated ‘community’ with unhappiness.
We will return to this finding later, but in brief, we think it is possible that the state level collectivism index by Vandello & Cohen (1999) fails to capture communal values in their index, and also that some of our word2vec models are trained on insufficient text data, which could have produced noise.

Sentiment analysis
We next conduct sentiment analysis on the dataset. We build two sentiment analysis pipelines using HuggingFace pretrained models, one using nateraw/bert-base-uncased-emotion (based on BERT) and one using cardiffnlp/twitter-roberta-base-sentiment-latest (based on RoBERTa). The RoBERTa model classifies posts as positive, negative, or neutral, while the BERT model classifies emotions according to a 6 basic emotions model (Shaver et al. 1996). This results in the final version of our dataset, with each post labeled with both 6-value and 3-value sentiment predictions:

We then take the mean value of each emotion for each state to produce an overall emotion level per state. Now we can compare states on average level of each emotion vs. collectivism index:


Contrary to our hypothesis, collectivism is positively associated with sadness, although not at a statistically significant level (P = 0.163, R2 = 0.043). We do find a statistically significant positive association between collectivism and two other sentiments: fear and neutrality. More collectivist states are more fearful (P = 0.011, R2 = 0.135), and more likely to evince neutral emotions than positive or negative ones (P = 0.000, R2 = 0.250).
State rankings
We can examine individual states for more insight into these results. Here are the top states for each of our six emotions and three affect states:

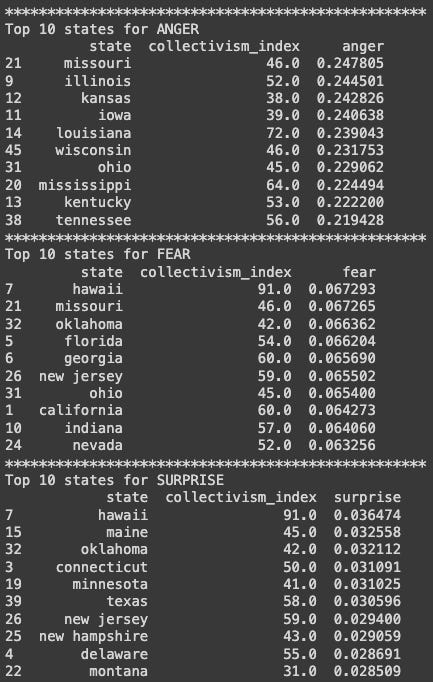

We (in Chicago) are sad to find that Illinois, with a middling collectivism index of 52, is both the saddest state in the union and the most negative. We wonder why this might be.
We are also intrigued by the results for our most collectivist state, an outlier in our graphs with by far the highest collectivism index (91):

Hawaii tops the rankings for both surprise and fear. We can next visualize the states’ positions on emotional rankings; here are surprise and fear (Hawaii is the black bar at the extreme right):


Hawaii is also very high on joy and love:


Yet low on anger:

Meanwhile, in the 3-category model, Hawaii is high on both neutral and positive sentiment, and low on negative:

Without having reviewed the literature on fear and neutrality, we hesitate to comment definitively on these results. But as a clear outlier on collectivism, Hawaii does significantly influence our findings1. We speculate that increased fear in Hawaii may be due to increased rates of natural disasters, and hypothesize that Alaska (which unfortunately was not included due to a data processing issue) will also be high on fear compared to the continental US. We are not sure how to explain the couccurance of high fear/surprise and high neutrality.
Survey
In order to understand the psychology of collectivism and individualism (C-I) more deeply, from the self selection of individuals in their behaviors, to their own perceptions of their feelings, we choose to analyze survey data in addition to image and text learning. There are key notions about happiness that differ when you consider images and text. For example, we think of images in two circumstances, framed and candid photos. These allow for constructed and natural observation of reactions and expressions. While text tends to be declarative, informative, inquisitive or entertaining, in which case there is no insulated measurement of a person, especially when the source of available text is public information on the internet. Surveys on the other hand provide a semi controlled notion of evaluation. They allow the respondent for introspection, and we can consider their own perceptions, values, and behaviors.
While surveys have other challenges such as the subjectivity of the individual, or possibility of deception or conceitedness, surveys provide us with a doorway to people themselves. The benefit (and the downside) is that we can approach the problem without the need of other pre-established indices which might not match up 1-to-1 with our data. Indices have their benefit when it comes to applying standard metrics in generalized settings, but given the survey data through this medium we are able to bring a bottom up approach to our analysis approach.
No analysis comes without preconceptions, but in this case we can provide a more general and hands-off approach. This way, rather than saying, we have a hypothesis of C-I increasing or decreasing happiness, sadness, or anger, we can instead say, we think these facets of life express the C-I dimension and then see their effect on emotions. (This of course has its limitations as we will see.)


Dataset
For this data we used the World Values Survey time series from 1981 to 2020 here. From this data we sampled under 30 thousand survey respondents from 2019 to 2020. As shown above the main question categories were those related to group activities and memberships, as well as feelings of concern. In addition to these questions, out of the 900 questions present over the 40 years of the survey, this cohort was only asked one question directly relating to happiness. The other questions about sadness, restlessness, etc. were discontinued in earlier waves of the survey. This meant that as far as emotions are concerned in the C-I dimension. We cannot say something definitive about the effect of C-I in happiness. Or at least we can say that statistically there is no effect of C-I in that particular question. The story does not end there however.
If we recall the initial indices that we used to understand state C-I then we can notice that they do not say anything about group participation, while our survey data is able to inform that dimension particularly well. The unfortunate limiting factor is that the WVS is a country level survey and does not provide state information for US respondents in order to create a comparison. These limitations aside, we can consider the question what really is collectivism or individualism, and why can we say that this happiness question does not show any effect?
Encoding
To do this we used a TableAutoEncoder. The idea is to train a Neural Network that will capture the relationships of the variables while reducing the dimension space, and then reverse the process a way to compare the actual vs reconstructed data and propage the learning through the network parameters. To do this I used 7 Dense layers first expanding to 128 channel inputs and then contracting to 3 channels, then reversing the process.

This way we were able to generate a compression of the data with three numbers that described each of the surveys in the “possible survey space.”

As shown above there was a fully disconnected component from all the others, and this prompted the question, “huh, why is it so far from everything else?” The more formal hypothesis was to say, if there is one group that significantly differs from another group in an embedding space spanned only by responses to notions of C-I, and if we are lucky then it will be the gap between people who are collective and individualistic.
After labeling we reconstructed not just the surveys, but every point in space to understand whether the space spanned on either side of this decision boundary was purely collectivistic or individualistic. Then we would truly be able to say that the space itself spans the C-I dimension. The short version is that the synthetic data points are not all purely one or the other. The long version is that each question has a different sensitivity to the groupings, but the best part is that we can test then see which questions are most sensitive to the labelings, and through that process we can build our own intuition behind what the boundary means. This way we need not think of our Neural Network completely as a black box, but rather we can describe concrete intuitions behind what the divide means.
Statistical tests

The most concrete way to do this is a statistical test over the distributions of each of the variables for the two “populations.” Since all of the variables are ordered categorical variables we can use the Chi2 Test of Independence to see which questions vary in their distribution according to the group labels. However, Chi2 is sensitive to sample size, so instead we use Cramér’s V which is a rescaling of Chi2 adjusted by sample size and for the minimum degrees of freedom in the contingency table.

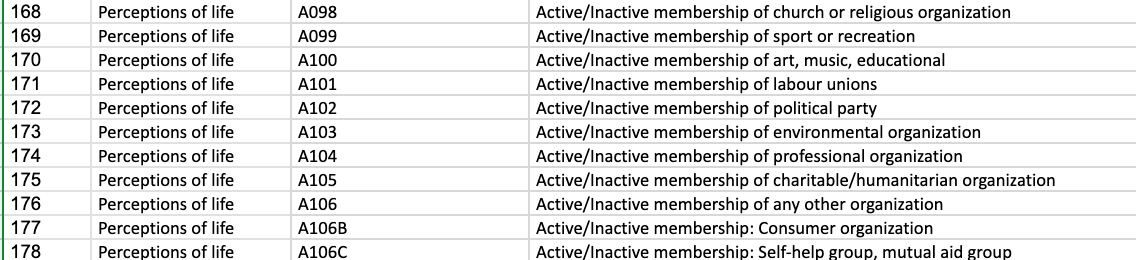
We can see two groups of variables are particularly sensitive in this case. The group on the left is the group membership and the group on the right is the person’ s concern about other people (friends, family, community,etc). In other words the gap projected onto the embedding space is indicative of the C-I domain. Particularly, they are indicative of … group memberships and feelings of concern for others. Now the natural question is they differ in what way and which groups.

In this plot we can see that one group is high in the left set of variables and low on the right set, and vice versa. The key to understanding is that the left group of variables a098-a106c are all positive scale, so high implies group membership, while the right variables are asked negatively, in other words, the higher the bar the less they feel concern about other people around them. Through this we can conclude that Group 0 is collectivist while Group 1 is individualist. Where is happiness in all this? Well, that is variable a008, for which Cramér’s V is less than 0.1 in the plot above.
What does this say about our Table Learning? Well the World Values Survey is highly indicative of the C-I behaviors and values of people with respect to group membership and feelings of concern for others. Meanwhile, this divide is not indicative of a C-I effect on happiness, for this question. This is important because as psychologist and late Nobel Laureate Daniel Kahnneman discovered, happiness as expressed in survey research is more indicative of subjective notions of temporal and relative happiness. One might have poor overall welfare and still be happy at any given moment. If you are more interested in the topic you can read about it here.
Discussion
Image
Overall, the two multinomial regression models show that people from more individualistic cultures are less likely to feel happy. At the same time, people from more individualistic cultures are less likely to have negative feelings, sadness, rather than positive feeling, happiness. The two multinomial models corroborate in lending support to our hypothesis.
We are glad to see that the predictions made by the RMN model helps support our hypothesis in our inferential analysis, where although all the coefficients are in the right direction, they all are less than one. The small values indicate that the possibility of people being happy may be higher for those from a more collectivistic culture, yet the likelihoods are really not as big as we expected them to be.
Therefore, at least two things could be done in future research to put our findings to test. First, more confounding variables could be included in the multivariate analysis to test the validity of current results. For example, the socioeconomic status of different race groups could have an impact on the results. After all, it is a known fact that the rich are more likely to be happier than the poor, regardless of cultural values.
Second, if budget permits, there are more close-source but sophisticated models in the facial expression recognition field that could provide more accurate prediction for human emotions. It is likely that a facial expression recognition model with an accuracy rate higher than 76.82% could help generate more reliable emotion labels for given images, and thereby improve the overall quality and robustness of the subsequent inferential analysis and insights derived from the image data.
Text
We did not find direct evidence for an association between state levels of communalism and happiness. In fact, the relationship we did find was negative, or rather, positive, since we were actually detecting sadness rather than happiness. But this positive correlation (P = 0.163, R2 = 0.043) between collectivism sadness and was not statistically significant, and only explained 4% of the sadness variation.
However, we did find statistically significant evidence of a correlation between collectivism and fear (P = 0.011, R2 = 0.135) and neutrality (P = 0.000, R2 = 0.250). More collectivist states are more fearful, and more likely to evince neutral emotions than positive or negative ones. We welcome input as to how to interpret these results.
Our word2vec model showed that more collectivistic states tend to associate ‘community’ with unhappiness. We believe this finding could explain why our results from text learning did not find a significant association between the collectivistic states and happiness. Per our hypothesis, collectivistic states are expected to be happier because they are more family, group and community oriented. However, if our results are valid, then we have shown that the states which are supposed to be collectivistic according to Vandello and Cohen (1999)’s index are in fact lacking in communal values.
To validate this result, we examined how Vandello and Cohen compiled their index. As shown in the table below, while the collectivism indicators included extensive measures for family, it only had one indicator for community, religious affiliation, which has a mere .05 item-total correlations.

In other words, Vandello and Cohen’s index capture largely the family dimension of collectivism, not the community dimension. If this is true, our conclusion for text learning would not be ‘collectivistic states are as happy as individualistic states’, but rather ‘states that care about family but not community are as happy as the rest of the states’.
Our textual study has several limitations. Due to the time required to load and process the posts at each state of the NLP pipeline, we restricted our posts/state to a limit of 10,000. Most states actually have 50,000-300,000 posts. Moreover, we were only to obtain 4,879 posts from Nevada, and none from Alabama, Alaska and Arkansas. Using a higher post limit and including these states would improve the robustness of our findings.
Additionally, although our overall 460,000-post dataset is reasonably sized, the 10,000-post dataset for each state may be too small for reliable training with gensim. We obtained some strange results from certain state word2vec models on the vector analogy questions that are typically used to verify the validity of these models (the prototypical example of these is king - man + women = queen):


In Louisiana, group + happy - sad = ghettos ?!!, while in Idaho group + suffer - enjoy = marijuana. While is it possible that such results reflect state idiosyncracies, they may also be artifacts of undersized samples. In the future, we hope to implement parallelization strategies to make working with a larger dataset more feasible.
Additionally, as noted, the use of state-specific subreddits is an imperfect proxy for geographic location. An interesting alternative/complementary study would be using tweets geocoded by state. We also hope to investigate further the reasons why states evince different emotions, and why, for example, Illinois is the saddest state.
Finally, our regression on sentiment analysis-detected emotions does not control for any state-level variables. To ensure the robustness of our findings, we should correct for cofounders such as income or (in the case of Hawaii) natural disaster occurance rates.
Survey
Overall the highlight of the survey model were the results of the Auto Encoders’ ability to detect a membership and concern expression of collectivism. Deep Learning models are in many ways less interpretable not because they hide their components but because their complexity limits our understanding. Being able to express their inner workings as a reduced set of interactions and provide statistical testing to understand their meaning as a classifier model for future survey respondents. Particularly, as we find that the C-I dimensions are most descriptive through group membership and feelings of concern, so we might prioritize these as a way to continue its analysis onward. Of course for an actual treatment analysis within a causal framework in statistics, one might desire a more rigorous framework to understand how little is too little happiness effect for it to be considered significant across the C-I dimension. We can consider this in the next iteration.
Particularly as it pertains to future direction, the survey analysis provides the most open ended path forward. The most clearly contained path within this framework is to build a multimodal framework to understand the actual effect of the C-I dimension in happiness from a causal perspective. While the image and text learning provide an associative framework we do not understand how the same subject might perform when subject to both testing simultaneously, and then the survey would be able to provide a label within the C-I dimension rather ran needing to assign a label based on a country or state level index as it is done in the other two methods. This is of course from a causal standpoint and within this framework. From a general perspective it makes more sense to use an Index to understand population wide effects. In a related direction, if we believe the association effect to be significant, then we could modify the surveys, leaving room for other questions that may inform other facets of people outside the C-I since this group of 10-15 questions appears to be specific and sufficient.
References
Ogihara, Y., & Uchida, Y. (2014). Does individualism bring happiness? Negative effects of individualism on interpersonal relationships and happiness. Frontiers in psychology, 5, 74922.
Rego, A., & Cunha, M. P. (2009). How individualism–collectivism orientations predict happiness in a collectivistic context. Journal of Happiness Studies, 10, 19-35.
Vandello, J. A., & Cohen, D. (1999). Patterns of individualism and collectivism across the United States. Journal of personality and social psychology, 77(2), 279.
Coon, H. M., & Kemmelmeier, M. (2001). Cultural Orientations in the United States: (Re) Examining Differences among Ethnic Groups. Journal of Cross-Cultural Psychology, 32(3), 348-364.
Kozlowski, A. C., Taddy, M., & Evans, J. A. (2019). The geometry of culture: Analyzing the meanings of class through word embeddings. American Sociological Review, 84(5), 905-949.
Kärkkäinen, K. & Joo, J. (2019). FairFace: Face Attribute Dataset for Balanced Race, Gender, and Age. Computer Vision and Pattern Recognition, arXiv:1908.04913. https://arxiv.org/abs/1908.04913
Merler, M., Ratha, N., Feris, R., Smith, J. (2019). Diversity in Faces. Computer Vision and Pattern Recognition, arXiv:1901.10436. https://arxiv.org/abs/1901.10436
Pham, L., Vu, T., & Tran, T. (2021). Facial Expression Recognition Using Residual
Masking Network. 2020 25th International Conference on Pattern Recognition (ICPR), Milan, Italy, Jan 10-15, 2021. https://ieeexplore.ieee.org/stamp/stamp.jsp?tp=&arnumber=9411919&tag=
With Hawaii removed, the association of fear and collectivism is no longer statistically significant
|
 | A guest post by
|
|
|